How the street changes are performing
These street changes were planned and installed between September 2021 and July 2023. The four goals of the project were to:
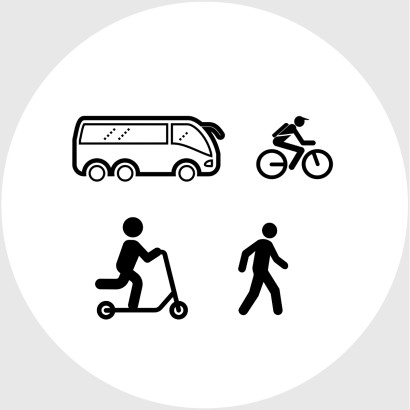
- increase low carbon journeys
- improve real and perceived user safety
- increase the diversity of people biking and using other forms of micromobility, and
- deliver improvements faster.
Using data and feedback from the 12 months following, our monitoring and evaluation report shares how this project is meeting these objectives: Newtown to city monitoring and evaluation report 2024 (4.4MB).